Introduce the capability
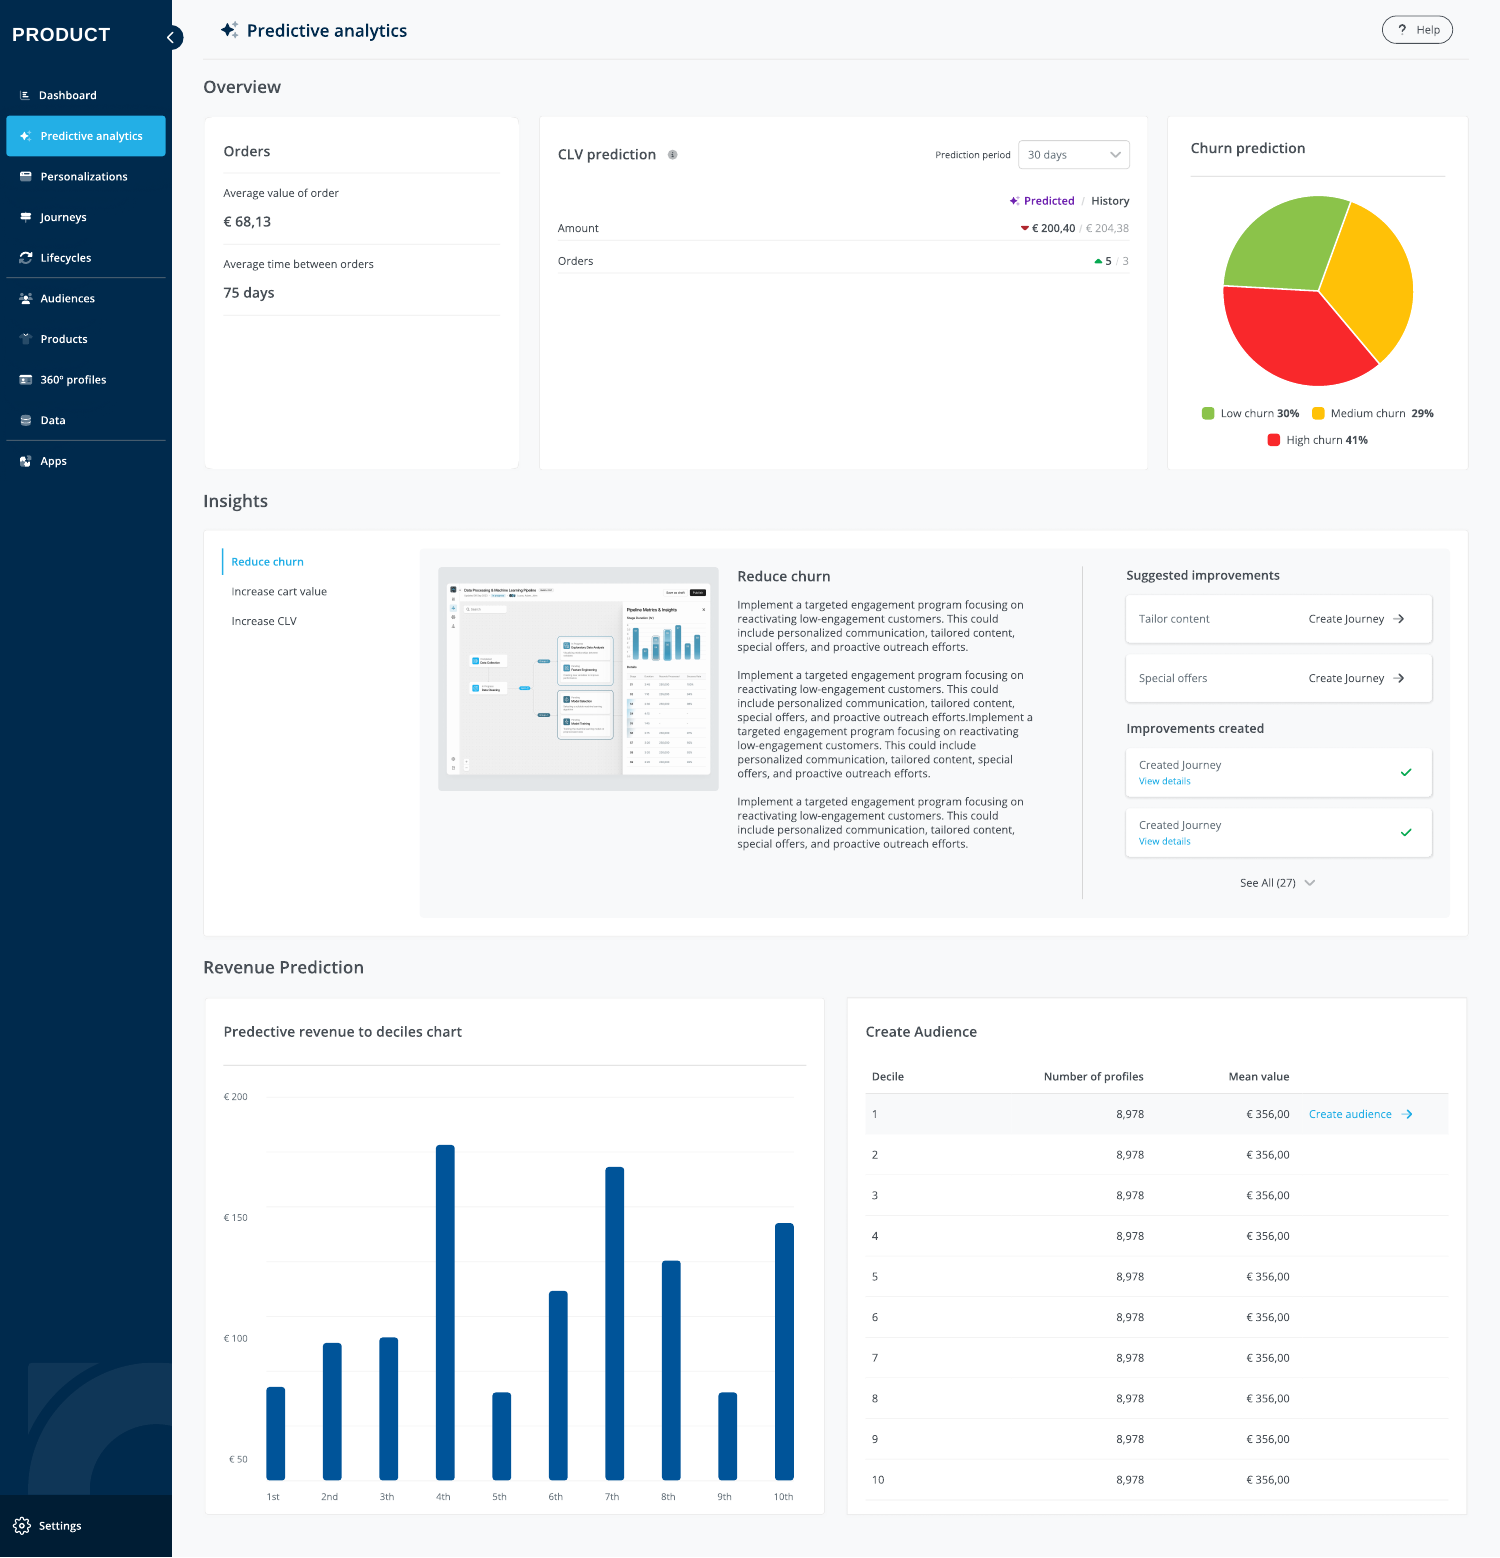
The first dashboard grouped predictions, churn and audience creation, but left the meaning of the forecast open to interpretation.
Making customer predictions understandable enough to trust—and useful enough to act on.
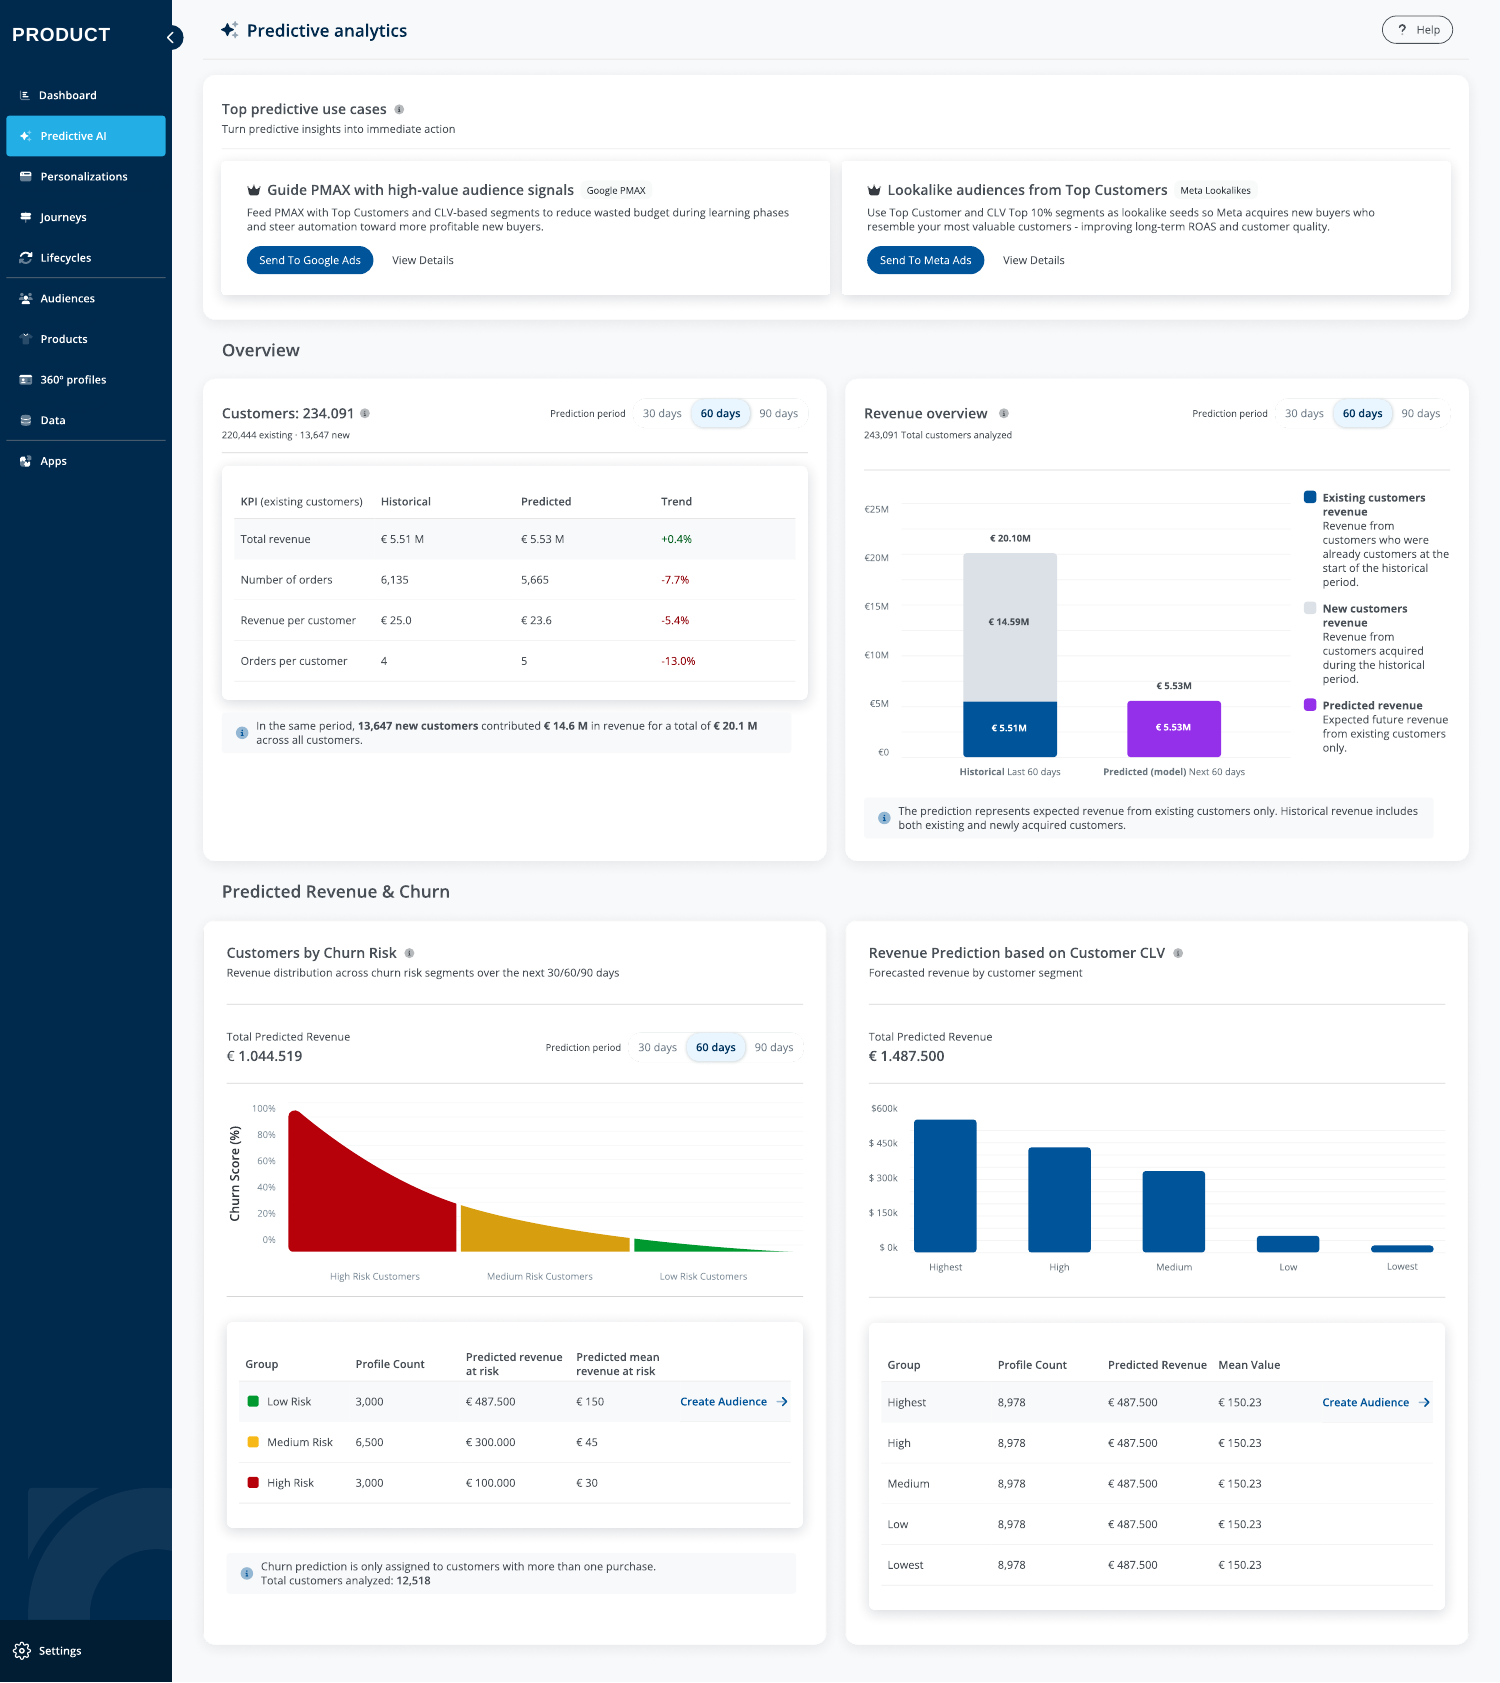
Predictive Analytics helps marketers explore customer value, churn risk and audiences built from those signals. The first version gave this new capability a place in the desktop product through cards, charts and direct routes into audience creation.
Once the feature was in use, qualitative feedback and a UX review showed a different challenge. People struggled to interpret scores and customer lifetime value (CLV) with confidence. Blank states, unclear labels and limited guidance made some outputs feel less reliable.
The redesign kept the ability to act on customer segments, but needed to explain the model’s limits more clearly.
The work moved from introducing predictive data, to making it easier to act on, to explaining exactly which customers each value represents.
The first dashboard grouped predictions, churn and audience creation, but left the meaning of the forecast open to interpretation.
Suggested use cases, clearer charts and five customer value groups made the feature easier to scan and use.
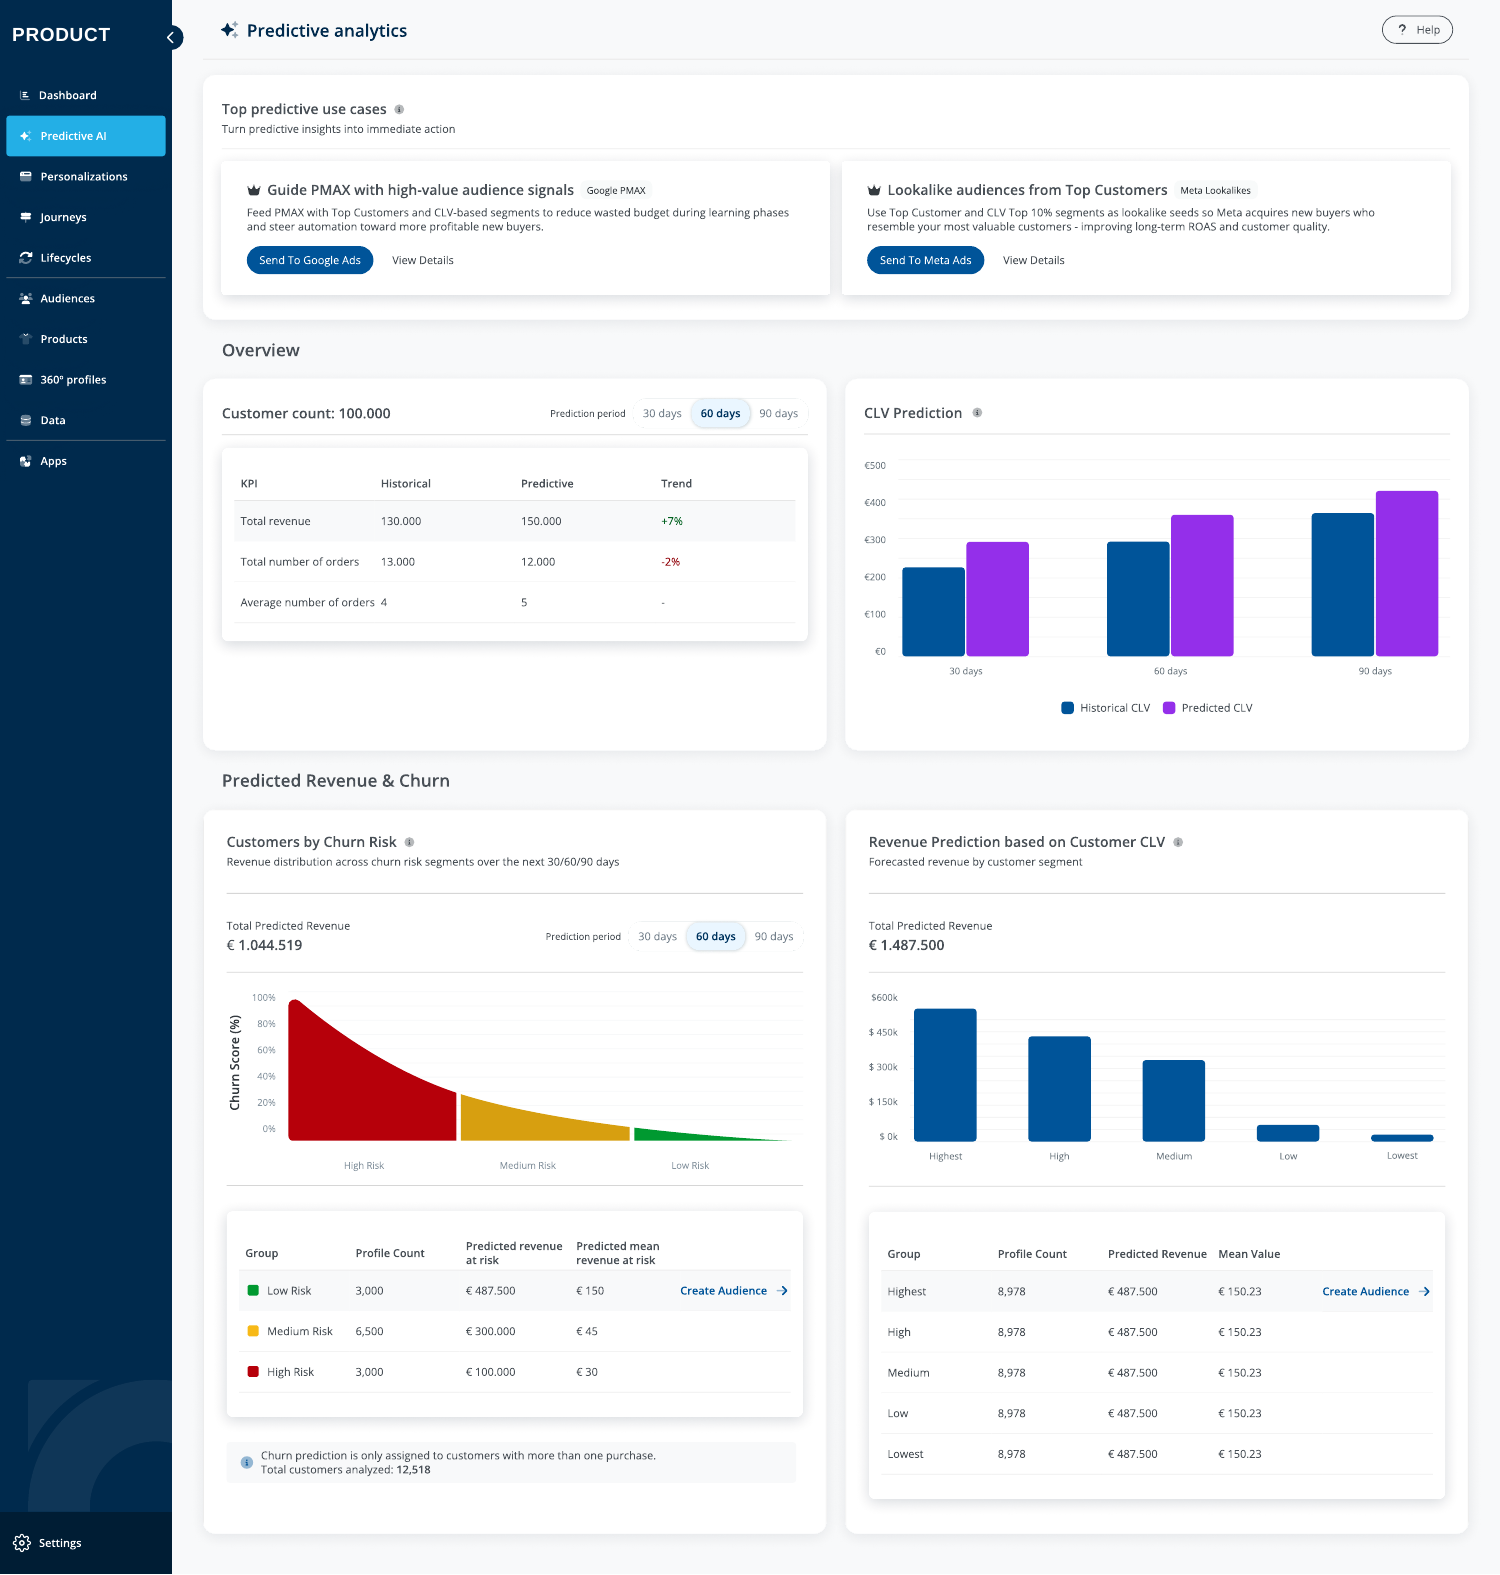
The final version distinguishes existing and new customers, and shows the prediction as future value from existing customers only.
The model estimates future value for customers the business already knows. Earlier historical totals included both existing and new customers. A direct comparison could be read as a forecast for total future company revenue, which the model does not provide.
A broader view of what happened in the past.
An estimate of future value for the known customer base.
Define the customer population before asking anyone to interpret the trend.
The final dashboard distinguishes existing from new customers. Its green/red trend compares past value with predicted future value for the same existing-customer group, rather than implying a forecast for the whole business.
Because historical prediction scores were not stored, a past-prediction-versus-current-prediction trend was unavailable. The interface therefore explains the comparison it actually makes.
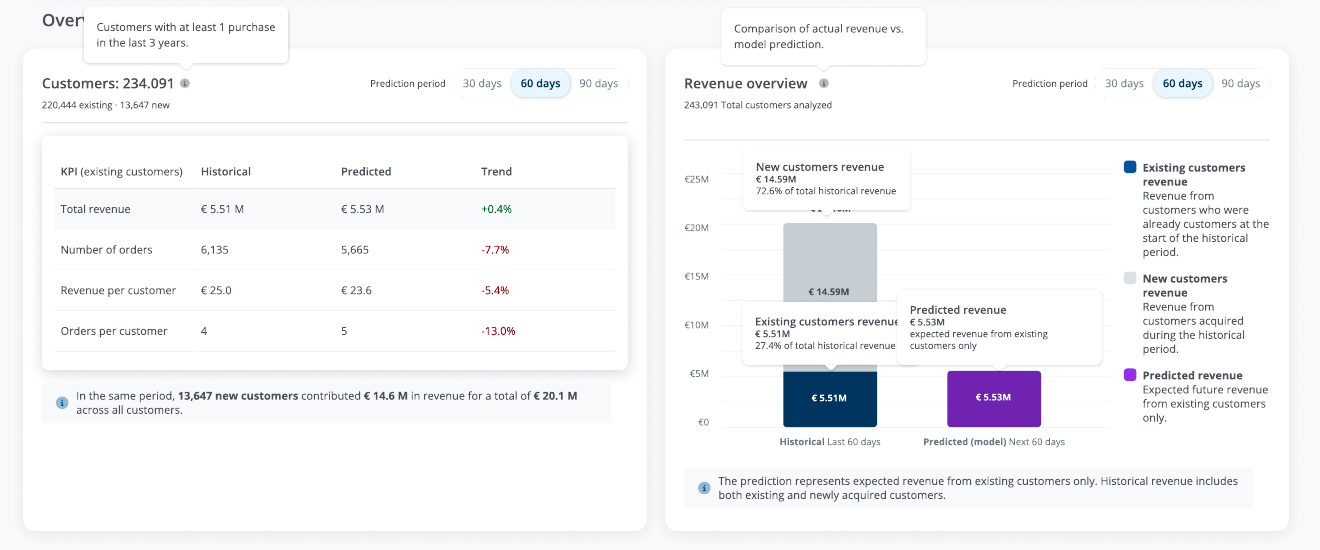
The model’s strength is ranking known customers by expected future value. The redesign retained customer segments and suggested use cases, using five value groups rather than ten to make the distribution easier to scan and target.
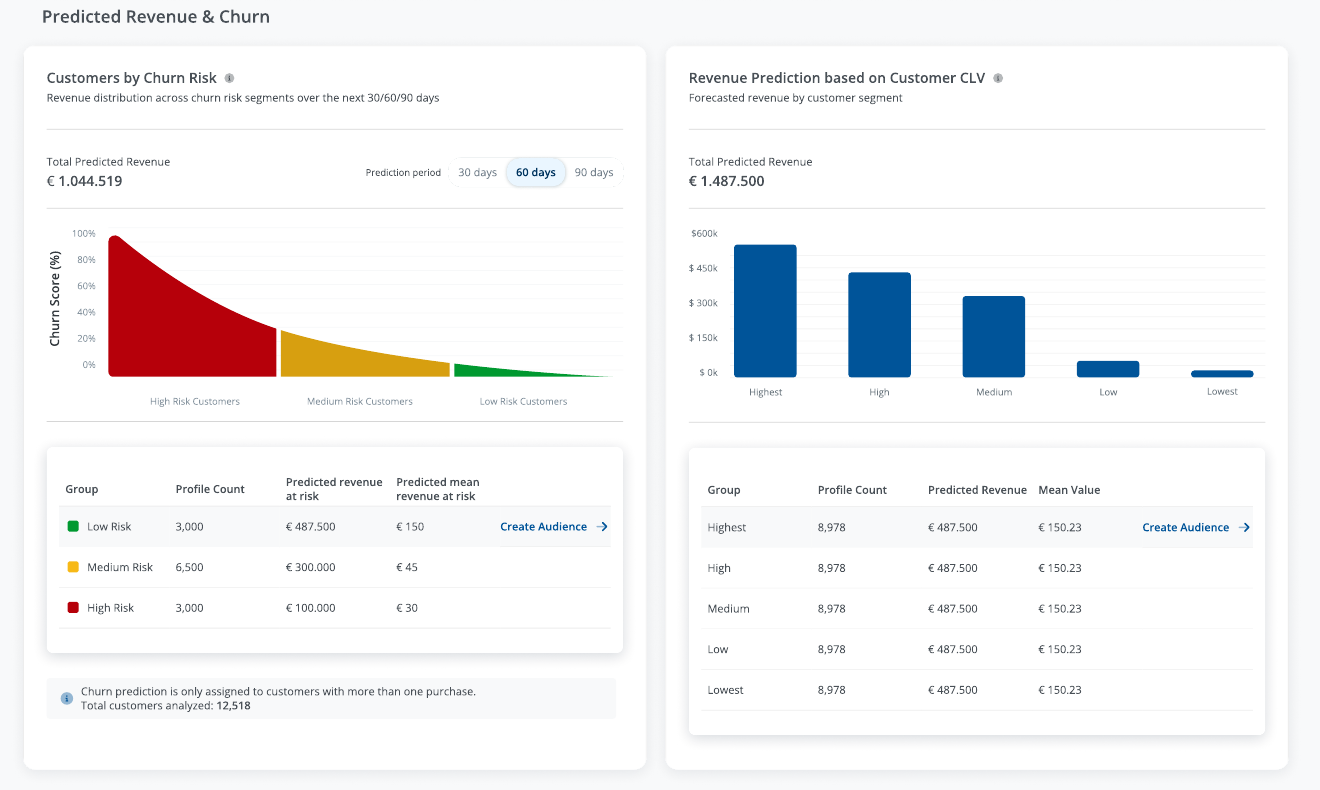
Clearer names, contextual tooltips and chart legends help people understand what a score means. Use-case details explain why an audience might matter, while the access state provides a clear next step.
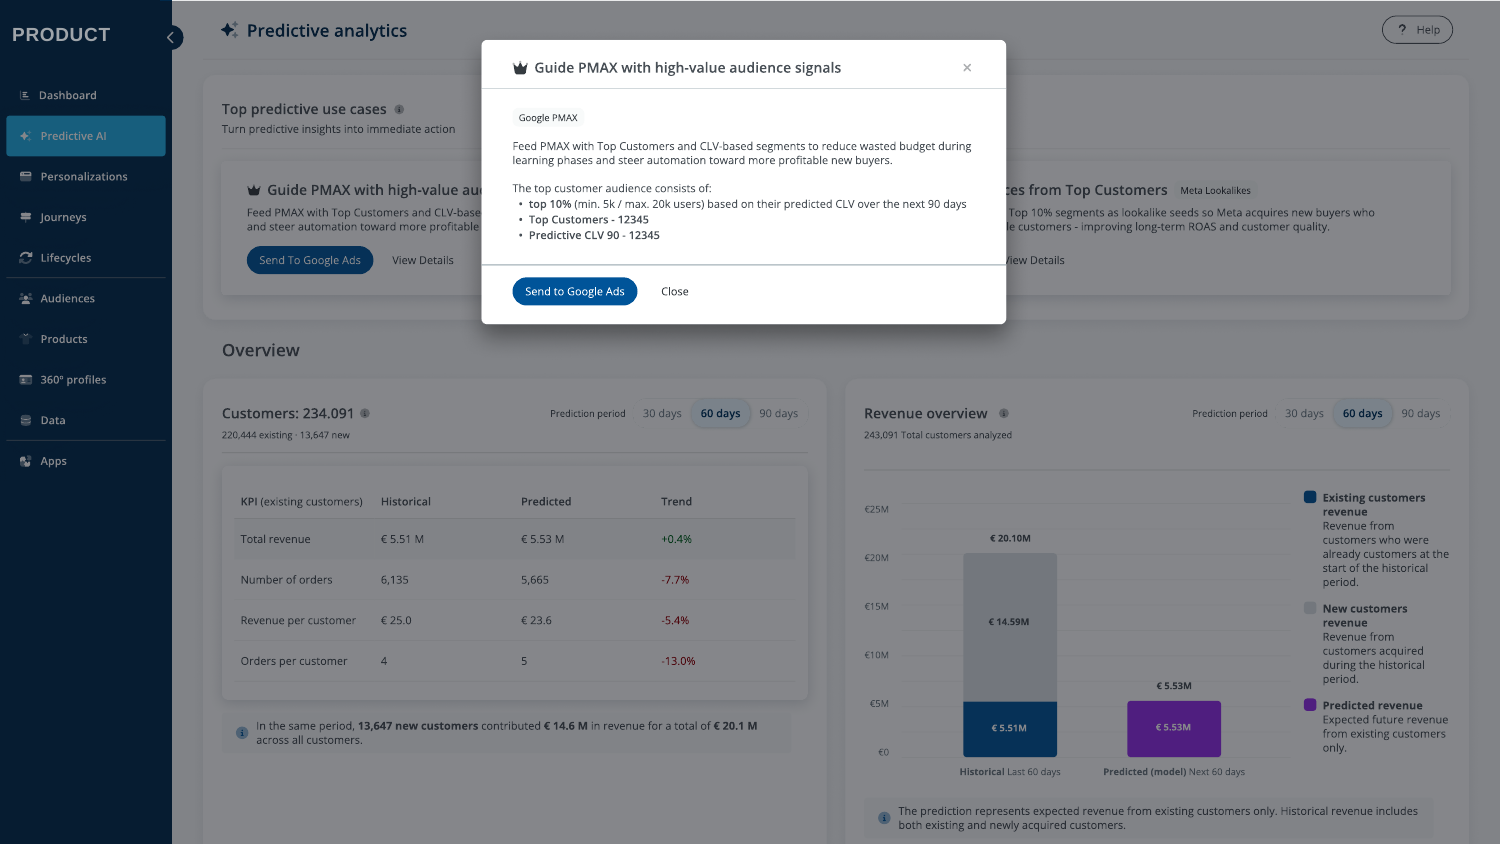
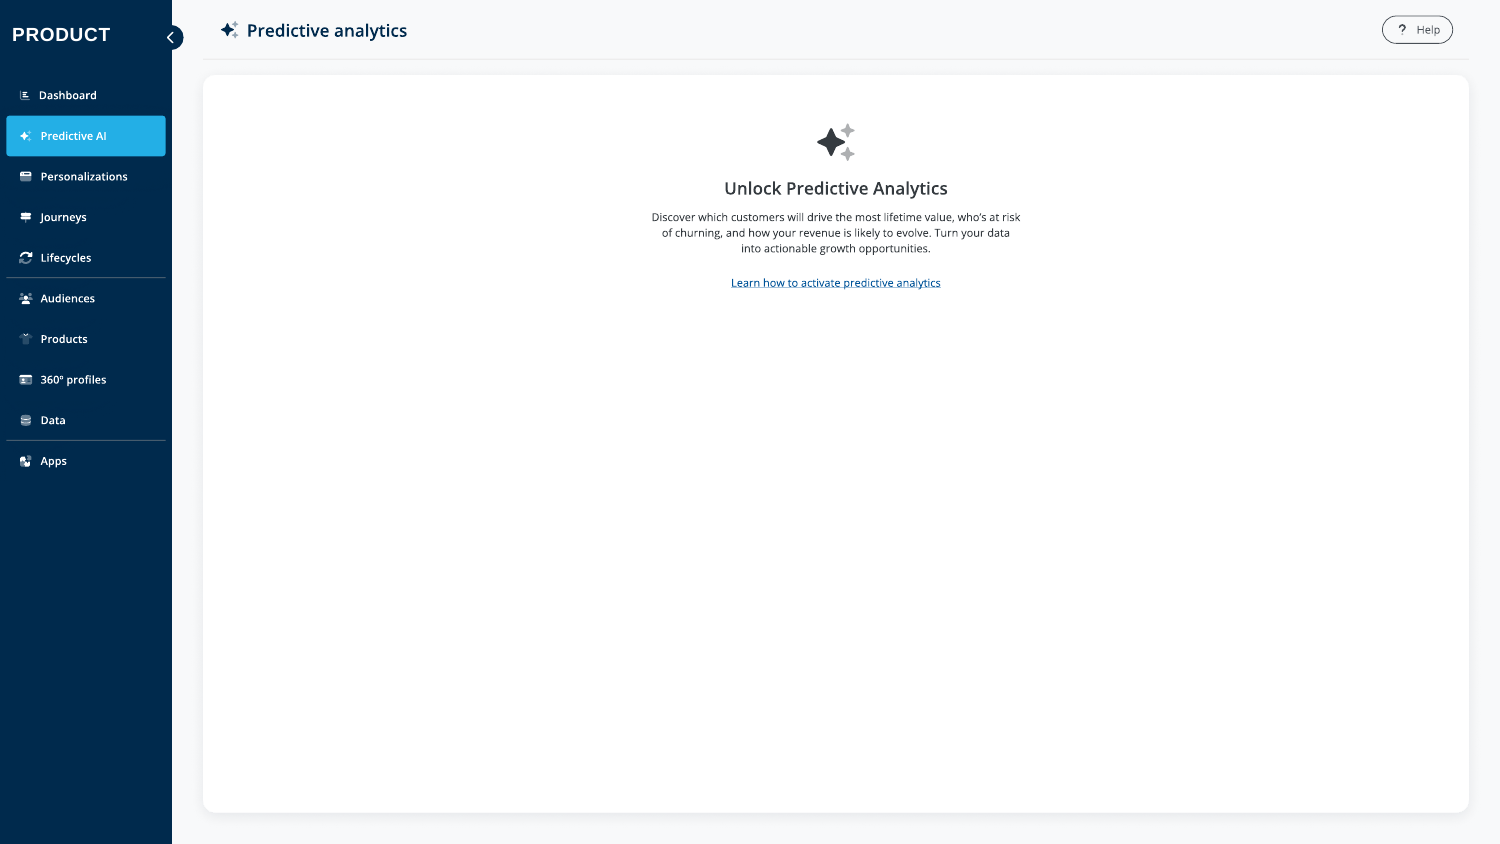
The redesign reframed Predictive Analytics as a way to understand and act on the future value of known customers.
The interface gives customer groups, scores and CLV more explicit meaning. The revised comparison makes the existing-customer scope visible, while suggested use cases and audience actions retain a practical path from insight to campaign work.
Explanations around model scope, missing data and access make the limits of each view part of the experience.